TL;DR
- LCLS imaging streams arrive fast and are high-dimensional, which makes real-time analysis hard.
- The paper proposes a rank-adaptive sketching pipeline that combines Priority Sampling with Frequent Directions.
- A tree-merge strategy makes sketching scalable across many cores, enabling PCA -> UMAP -> OPTICS for visualization and clustering.
Problem setting
At the Linac Coherent Light Source (LCLS), detectors produce shot-to-shot image data used for instrument diagnostics and scientific analysis. The paper highlights two main constraints:
- Throughput: detectors can run at roughly 120 frames per second.
- Dimensionality: beam-profile images can be multi-megapixel, which makes direct analysis expensive.
These pressures motivate compact, mergeable summaries that preserve structure while keeping memory bounded.
Key idea
Use matrix sketching to compress a large batch of images into a smaller summary matrix that preserves the dominant structure. Then apply:
- PCA for a linear reduction,
- UMAP for a 2D visualization,
- OPTICS (or similar) for clustering and outlier detection.
The core twist is to make the sketch rank adaptive based on a user-specified error tolerance rather than a fixed rank.
The sketching objective can be summarized as preserving the covariance structure:
Method (high level)
The paper proposes an end-to-end pipeline:
- Sketch + PCA: build a compact sketch, then compute a PCA projection.
- UMAP to 2D: obtain a visualization suitable for monitoring.
- Clustering and outliers: use OPTICS (or related methods) to surface structure.
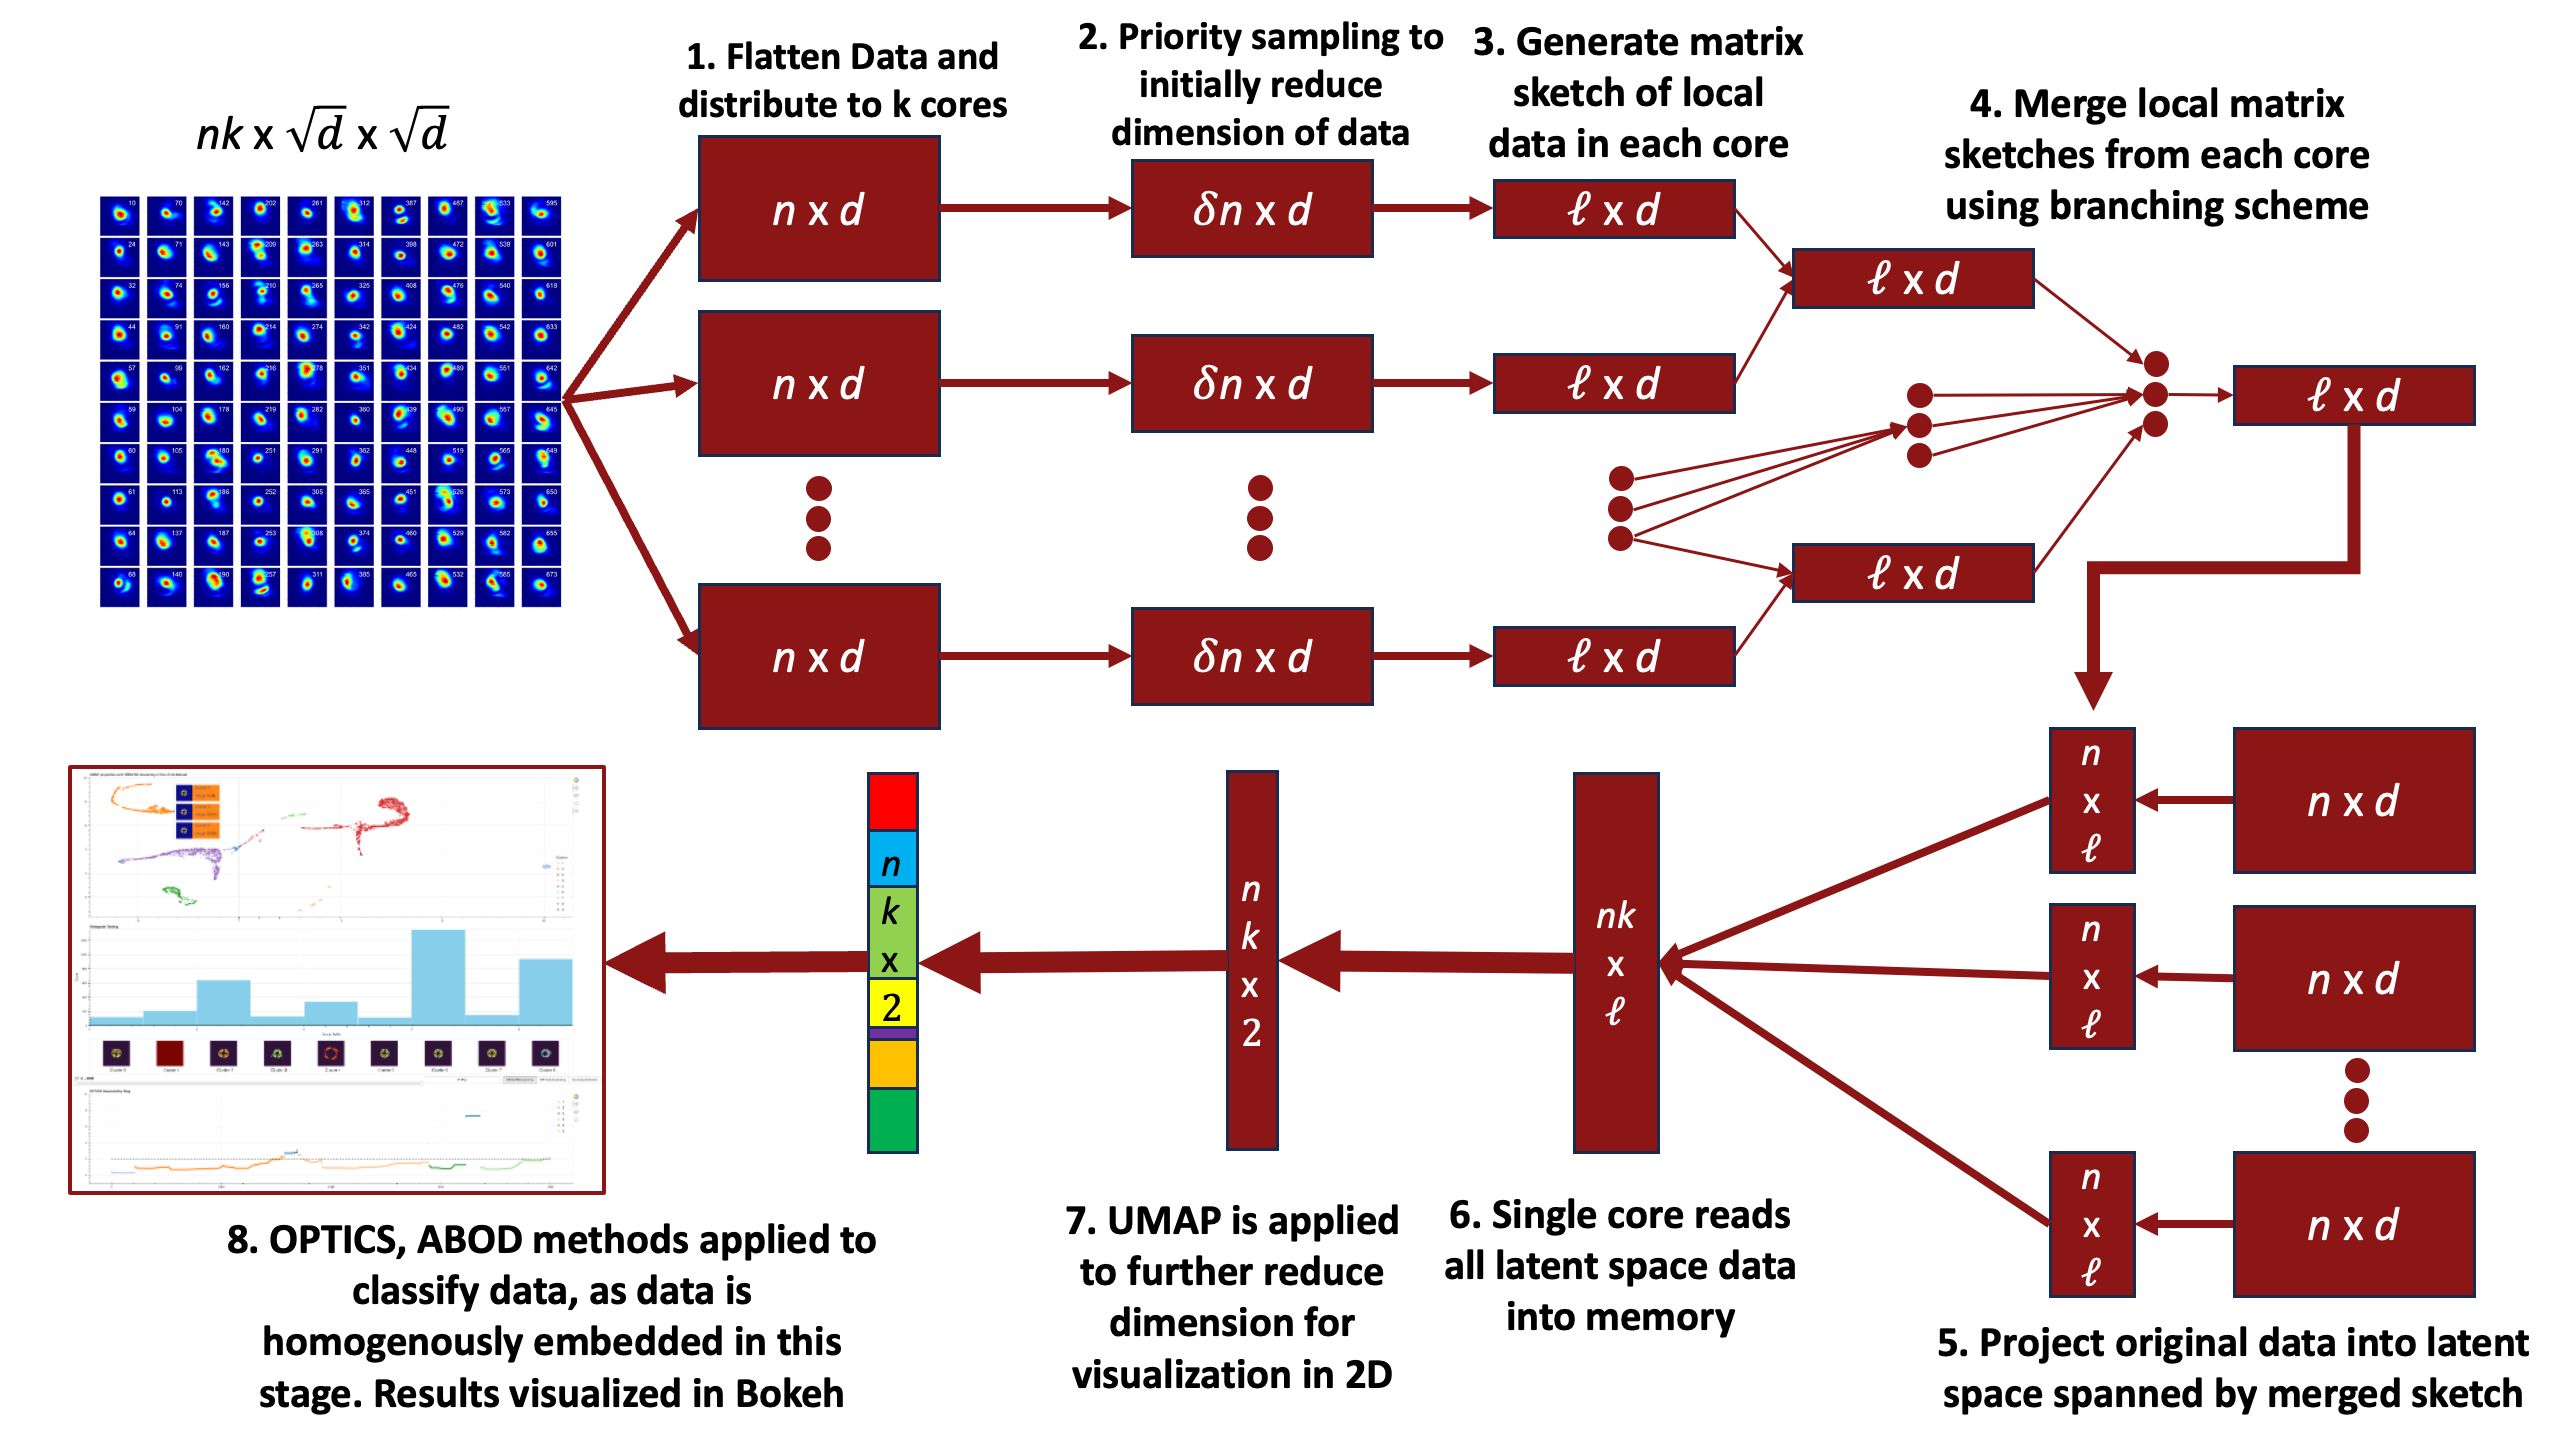
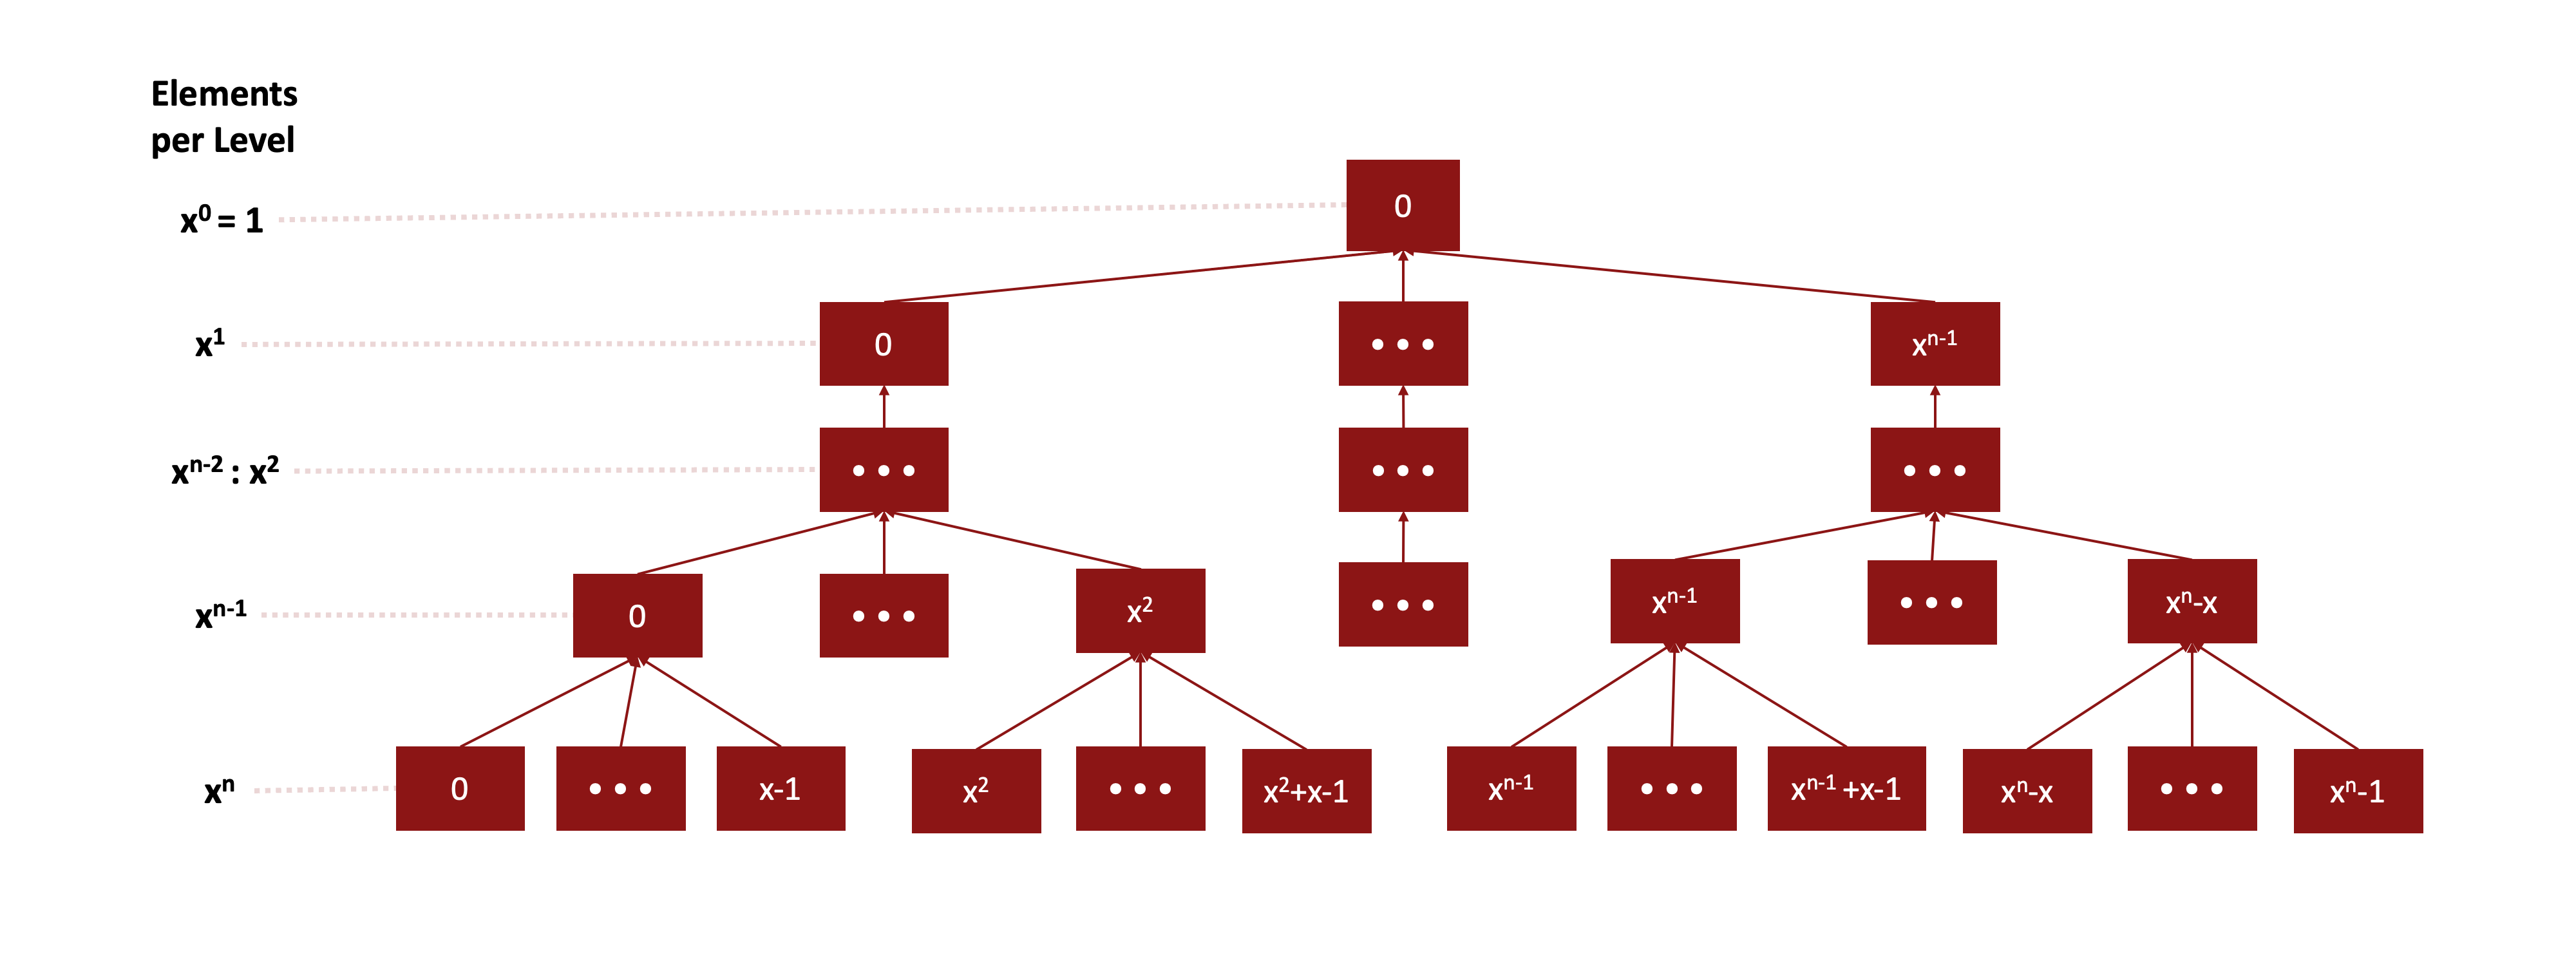
Scaling: tree-merge sketches
Frequent Directions sketches are mergeable. The paper uses a tree-merge strategy to combine per-core sketches with a logarithmic number of merge steps, which avoids a serial bottleneck at scale.
Evidence in the paper
The paper reports:
- Synthetic studies that compare rank-adaptive vs fixed-rank sketching and show favorable runtime/error trade-offs with Priority Sampling.
- A parallel scaling study showing that tree-merge reduces merge steps and scales better than serial merging.
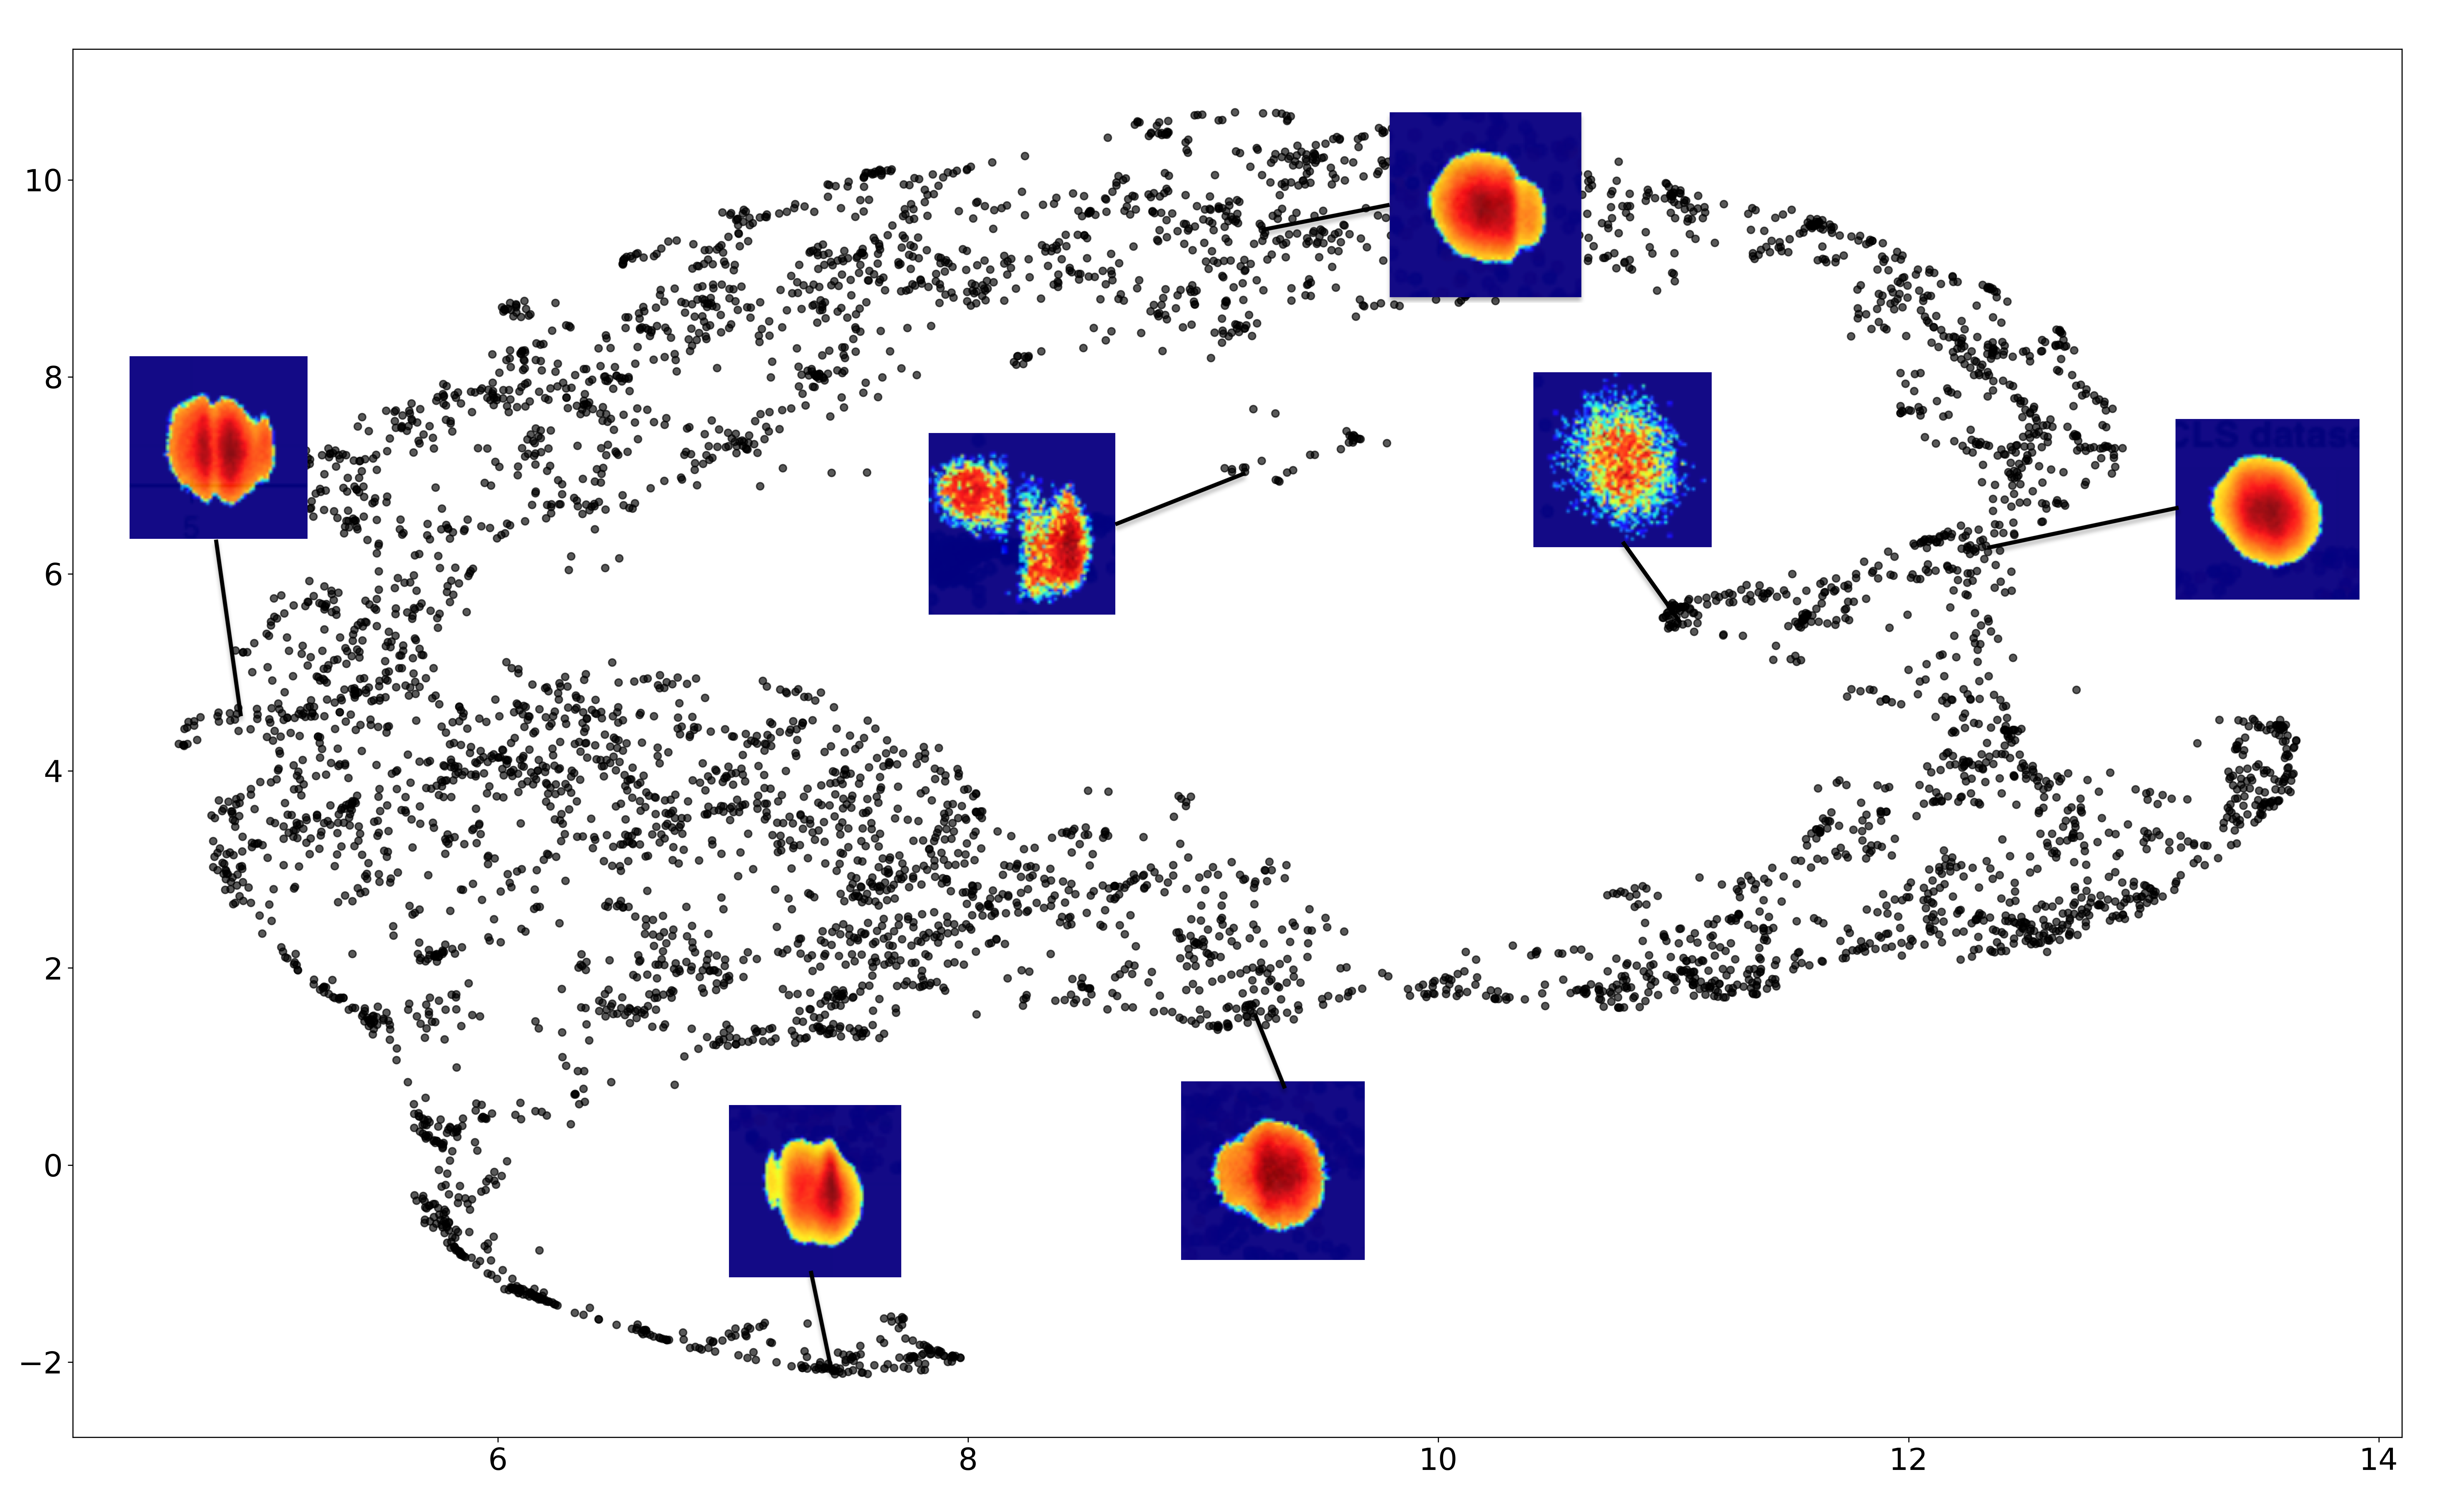
- LCLS imaging results that produce interpretable low-dimensional structure for beam profiles and diffraction data.
Limitations and open points
- Many hyperparameters are not fully specified, which makes exact reproduction difficult.
- Some results on real LCLS data are qualitative rather than fully quantitative.
- The paper suggests better error estimators for rank adaptivity as future work.
Takeaway
The main contribution is a practical, scalable sketching pipeline that makes online analysis feasible for LCLS-scale imaging streams.